

Making decisions in business-to-business (B2B) projects requires a cost-benefit analysis. This is because every business decision, no matter how small, always carries consequences.
Several things must be considered: is this project feasible to execute? Will the investment bring long-term benefits? This is where the importance of an analytical approach comes into play, helping us weigh the pros and cons before making a big move.
In the world of microeconomics, and especially in B2B projects, this analysis is not just a scribble of numbers on paper, it becomes the foundation that enables companies to make more rational, measured, and strategically aligned decisions.
What is Cost-Benefit Analysis in Microeconomics?

Simply put, cost-benefit analysis is a systematic process to evaluate all potential costs and benefits of a business decision. In microeconomic context, this analysis used to assess the impact of decisions at the level of small economic units, such as companies, divisions, or specific projects.
The goal is not just to find the highest profit but also to ensure that every resource is used as efficiently as possible. This is especially relevant for B2B companies facing large-scale, long-term impact decisions such as new technology purchases, strategic partnerships, or market expansions.
This analysis also goes beyond conventional financial calculations by incorporating non-financial aspects and opportunity costs, which often overlooked in traditional evaluations.
Meanwhile, opportunity cost is economic concept that represents the value of the best alternative that must sacrificed when choosing one option over another. The formula for calculating opportunity cost is:
Opportunity Cost = Value of the alternative forgone
In a more specific context, if you have two options, A and B, and you choose A, then the opportunity cost of choosing A is the value you would have obtained from B.
This concept is also very relevant for B2B companies that frequently face major, long-term decisions, such as investing in new technology, forming strategic partnerships, or entering new markets.
For example, before adopting a new ERP system, a company will evaluate the implementation and employee training costs and compare them with benefits such as improved operational efficiency and reduced data errors, to ensure the investment adds real value.
A study by Boardman et al. (2018) in the book “Cost-Benefit Analysis: Concepts and Practice” confirms that proper use of this method helps companies identify and address the economic impacts of each decision alternative, thereby increasing the accuracy and effectiveness of business decisions.
Discover More : The Role of GDP in Assessing Economic Performance
Fundamental Components and Concepts: Cost vs. Benefit

Before delving into various cost-benefit analysis methods, it’s essential to clearly understand what constitutes costs and benefits. In the context of microeconomic evaluation and B2B projects, this classification forms the foundation for conducting comprehensive and accurate analysis.
Direct Costs
Direct costs are those that can be directly attributed to specific activity, project, product, or department. These costs are typically tangible, measurable, and explicitly recorded in financial reports.
Their main characteristic is the ease of identification and calculation because they are directly related to production or project implementation, such as raw material purchases or wages. These are usually actual cash outflows that support operational activities.
Examples of direct costs include:
- Initial investment in asset purchases: such as production machinery, computers, or technology devices.
- Daily operational costs: including fuel, electricity, or raw materials.
- Direct labor payroll: salaries of workers directly involved in the project.
- Technical training costs: to ensure employees can efficiently operate new systems or equipment.
Indirect Costs
On the other hand, indirect costs tend to be hidden and harder to associate with a specific activity. These costs have broad impacts across various aspects of the business, even if not always explicitly stated in financial reports.
Indirect costs are often harder to quantify because they involve managerial consequences, such as lost time, reduced efficiency, or missed opportunities. Though less visible, they still significantly affect business strategy effectiveness.
Examples of indirect costs include:
- Time lost due to transition processes: such as reduced efficiency during adaptation to a new system.
- Temporary business disruptions: like delivery delays or production errors during implementation.
- Opportunity cost: the potential gain lost by choosing one decision option over another equally promising one.
Meanwhile, the benefits of a decision or project can take various forms and are not always easy to quantify financially. The most obvious benefits usually include revenue growth, process efficiency, or long-term cost savings.
However, intangible benefits are equally important, such as increased customer satisfaction that contributes to loyalty and retention, or enhanced brand reputation and positioning that can open new business opportunities and strengthen market competitiveness.
Because of this diversity, effective evaluation often requires a combination of quantitative and qualitative approaches to truly reflect the economic and strategic value of a decision.
A deep understanding of cost and benefit components helps companies avoid focusing solely on easily calculated figures and encourages them to also consider broader, long-term impacts that may result from the business decisions taken.
Commonly Used Cost-Benefit Analysis Methods

In business decision-making—especially in microeconomic and B2B project contexts, cost-benefit analysis methods are vital for assessing investment feasibility and effectiveness. Choosing the right method depends on project characteristics, data availability, and the purpose of the analysis.
1. Discounted Cash Flow (DCF)
The DCF method calculates the present value of future expected cash flows from a project. The main concept is the time value of money, which recognizes that money received today is worth more than the same amount in the future due to risk and investment opportunity factors.
Future cash flows are discounted using rate that reflects risk and cost of capital. This method is ideal for long-term projects where cash flows spread over several years.
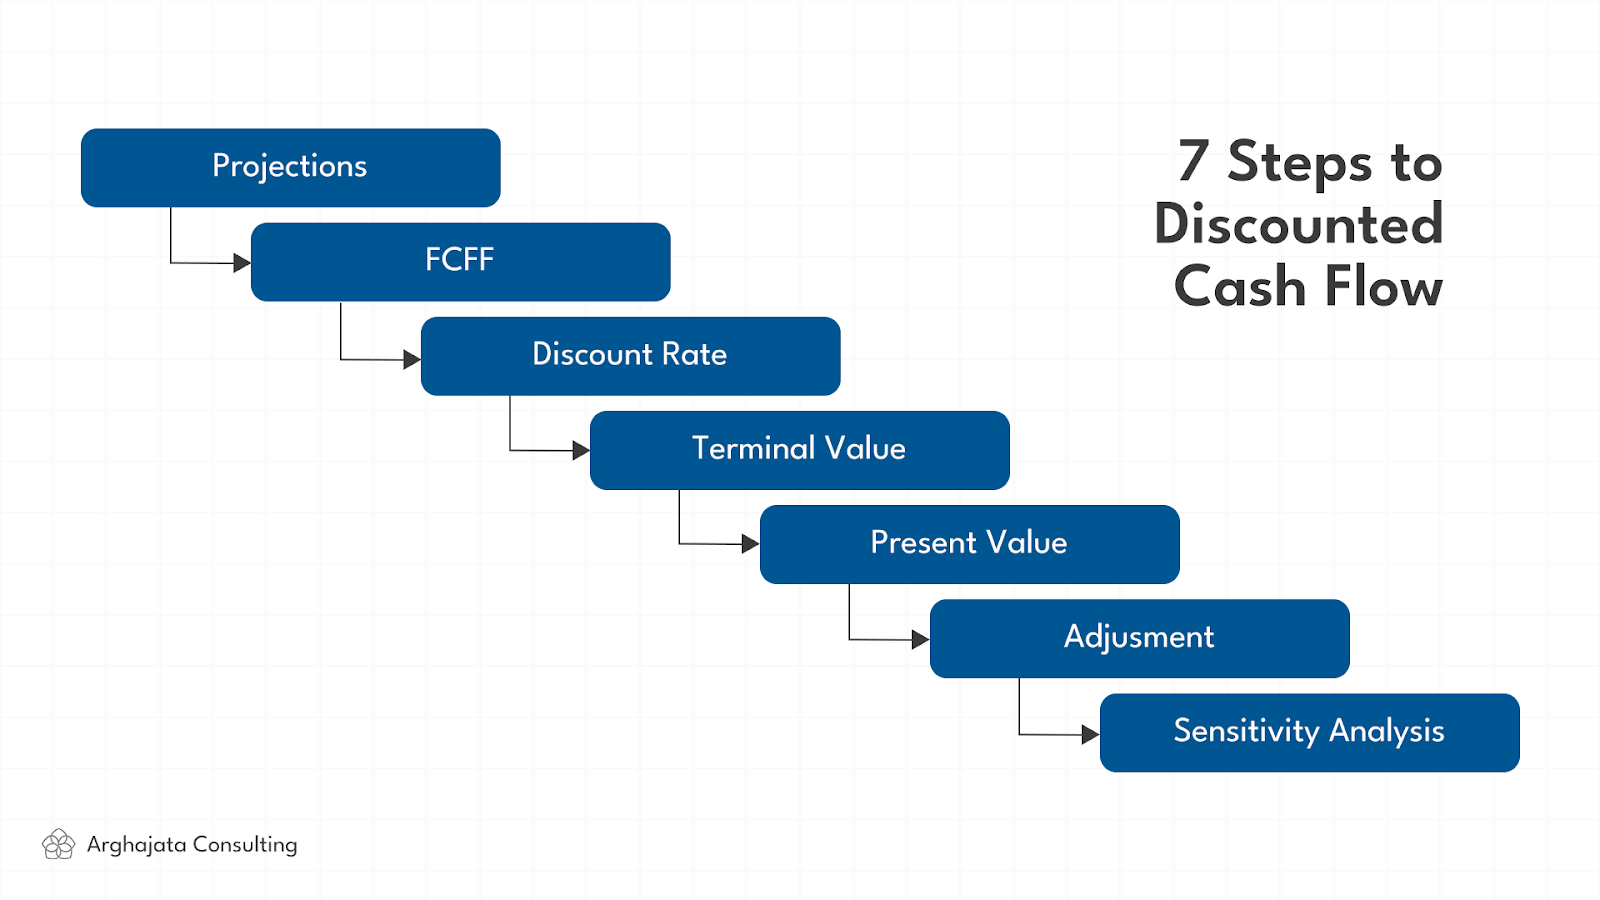
Example: A manufacturing company plans to replace its production machine with a large investment. Using DCF, they calculate the total additional cash flows over the machine’s 10-year lifespan, discounted to the present value, to assess whether the investment is financially sound.
2. Net Present Value (NPV)
NPV is the result of a DCF calculation showing the difference between total benefits and total costs already discounted to present value. A positive NPV suggests the project adds financial value; a negative NPV indicates potential loss.
NPV is a key indicator for objectively evaluating project feasibility by integrating time and risk into a single, understandable figure.
NPV Formula:
NPV = Σ (Ct / (1 + r)^t), from t = 0 to t = n
Where:
- Ct = cash flow at period t (C0 is usually the initial investment, negative)
- r = discount rate (rate of return or cost of capital)
- t = time period (years)
- n = total number of periods
Example: A tech company considering investing in new app development project calculates an NPV of Rp500 million, meaning the project expected to generate that amount in net value today.
3. Internal Rate of Return (IRR)
IRR is the discount rate at which a project’s NPV equals zero. In other words, it reflects the internal rate of return on a project investment. It’s useful for comparing multiple investment options, selecting the one with the highest return.
However, IRR works best with conventional cash flows. For irregular cash flows, IRR may be misleading.
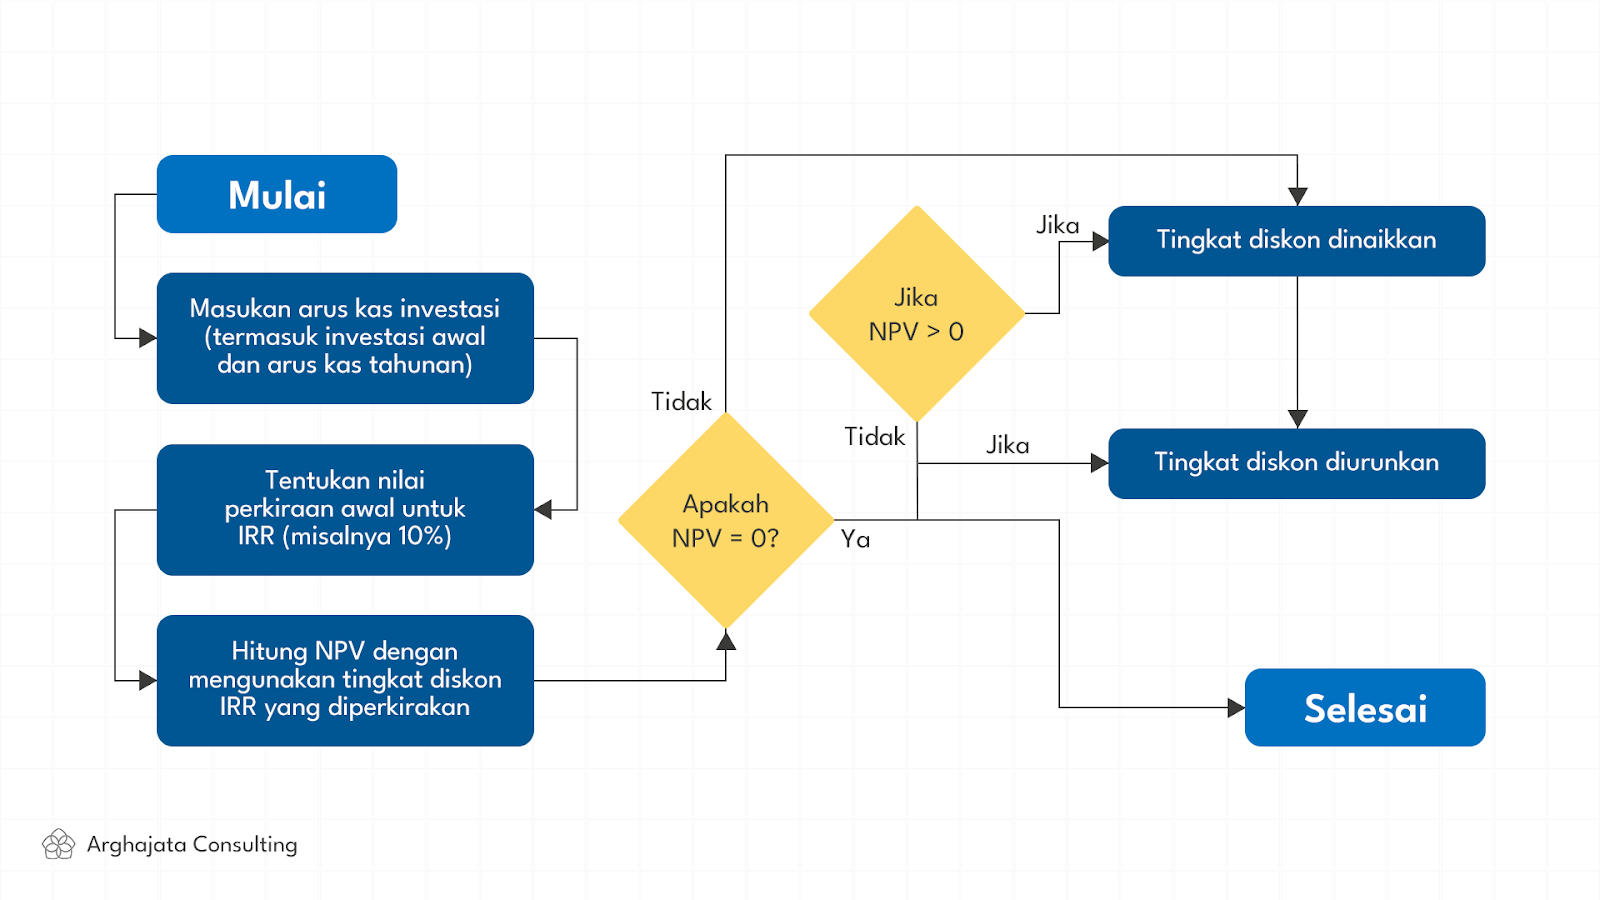
Flowchart overview: The process begins by inputting investment and annual cash flows, estimating an IRR (e.g., 10%), and calculating the NPV. If the result is zero, the IRR is found. If not, the discount rate is adjusted until NPV equals zero.
4. Sensitivity Analysis
This method tests how the final result changes if key assumptions—such as costs, revenues, or discount rates—are altered. It’s essential for managing uncertainty and identifying risk tolerance.
Example: A finance team examines how a 10% increase in raw material costs affects the profitability of a production expansion. If the NPV drops sharply, risk mitigation or reevaluation may be necessary.
5. Payback Period
This measures how long it takes for an investment to recover its initial cost through incoming cash flows. While it ignores the time value of money, it’s useful for assessing liquidity and short-term risk.
Example: A startup wants to know how quickly its software development costs will be recouped. If the payback period is three years, this means profits start after that time.
Each of these methods, when selected and applied properly, offers a strong analytical framework to support strategic decision-making in B2B contexts.
Discover More : Data-Driven Decision Making (DDDM) untuk Pengambilan Keputusan Valid
Case Study: Applying Cost-Benefit Analysis in a B2B Project

A B2B tech company is considering developing a new digital platform for enterprise clients. The project requires initial investment of Rp3 billion and expected to generate Rp800 million in annual cash inflows over the next five years.
The finance team uses NPV and DCF to calculate the present value of these projected cash flows. To increase the analysis’ robustness, they also apply sensitivity analysis—testing scenarios such as a 20% cost overrun or weak market response.
The evaluation shows a positive NPV, indicating that the financial benefits exceed the costs. An IRR of 18% signals that the project offers a competitive return. The payback period is four years, suggesting the investment will be recovered relatively quickly, even though the first two years yield minimal returns.
The final decision goes beyond the numbers, factoring in intangible benefits such as improved brand positioning and the potential for new strategic partnerships. This multi-method approach provides a holistic foundation for a well-informed, strategic investment decision.
Cost-benefit analysis isn’t just about numbers. It’s a comprehensive process that helps companies see the bigger picture, evaluate potential, and reduce uncertainty in decision-making. For B2B businesses, applying this method can be the difference between speculative and truly strategic decisions.
If your company is considering a major project or investment plan, Arghajata Consulting is ready to assist. Our experienced team applies cost-benefit analysis methods with precision, delivering insights that are data-driven and aligned with long-term results.


 Business Process Alignment")


")


")


 Energy & Utilities")