Indonesia’s logistics shows improvement but still needs much improvement
Indonesia’s Logistics Performance Index (LPI) in 2018 reached a score of 3.15 out of 5. This score is the highest score achieved by Indonesia since 2007. The assessment conducted by the World Bank uses 6 criteria, namely the efficiency of customs clearance & border management, the quality of trade & transportation-related infrastructure, the ease of arranging international shipments at competitive prices, the competence & quality of logistics services, the ability to track & trace shipments, and the frequency of shipments reaching the scheduled / expected time. Of the six criteria, Indonesia is weakest in terms of efficiency of customs clearance & border management and quality of trade & transportation-related infrastructure.

Grafik 4.1. Score Logistics Performance Index Indonesia per indikator Tahun 2007 – 2018 oleh World Bank
Indonesia ranks 51 out of 167 countries involved in the 2018 Logistics Performance Index (LPI) assessment. When compared to ASEAN countries, Indonesia is ranked 5th behind Singapore, Thailand, Vietnam, and Malaysia.
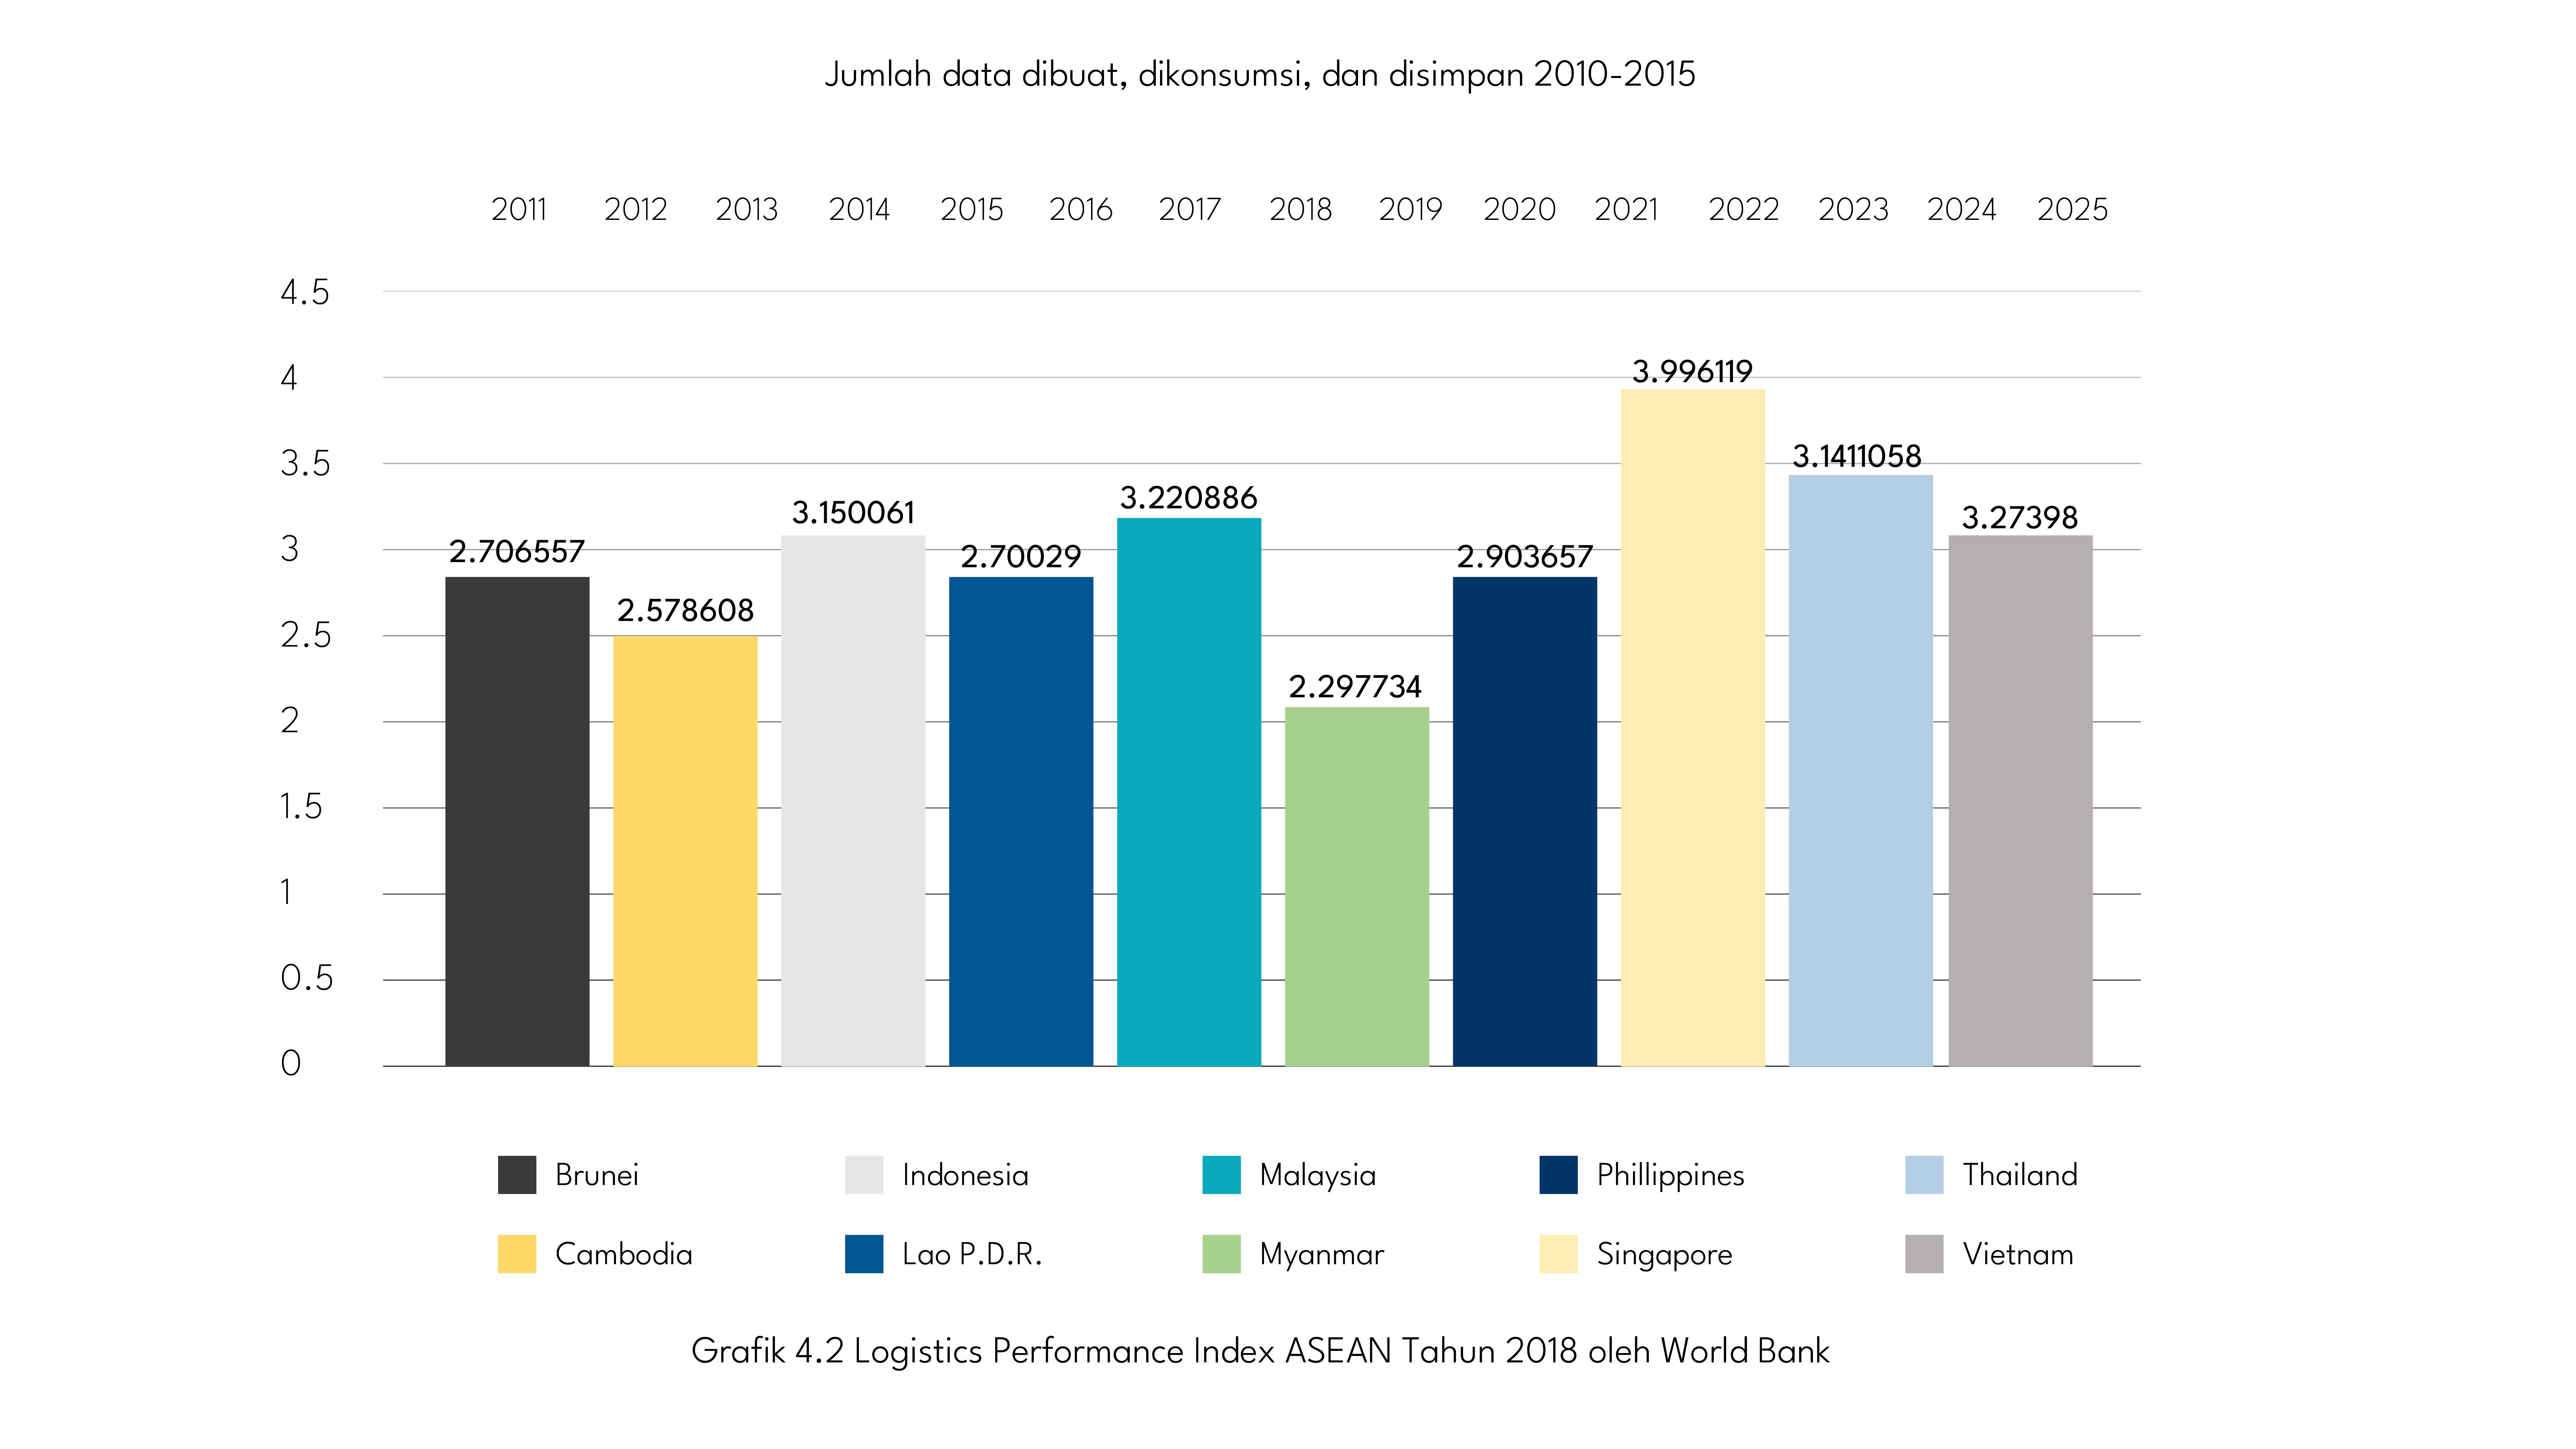
Grafik 4.2. Logistics Performance Index ASEAN Tahun 2018 oleh World Bank
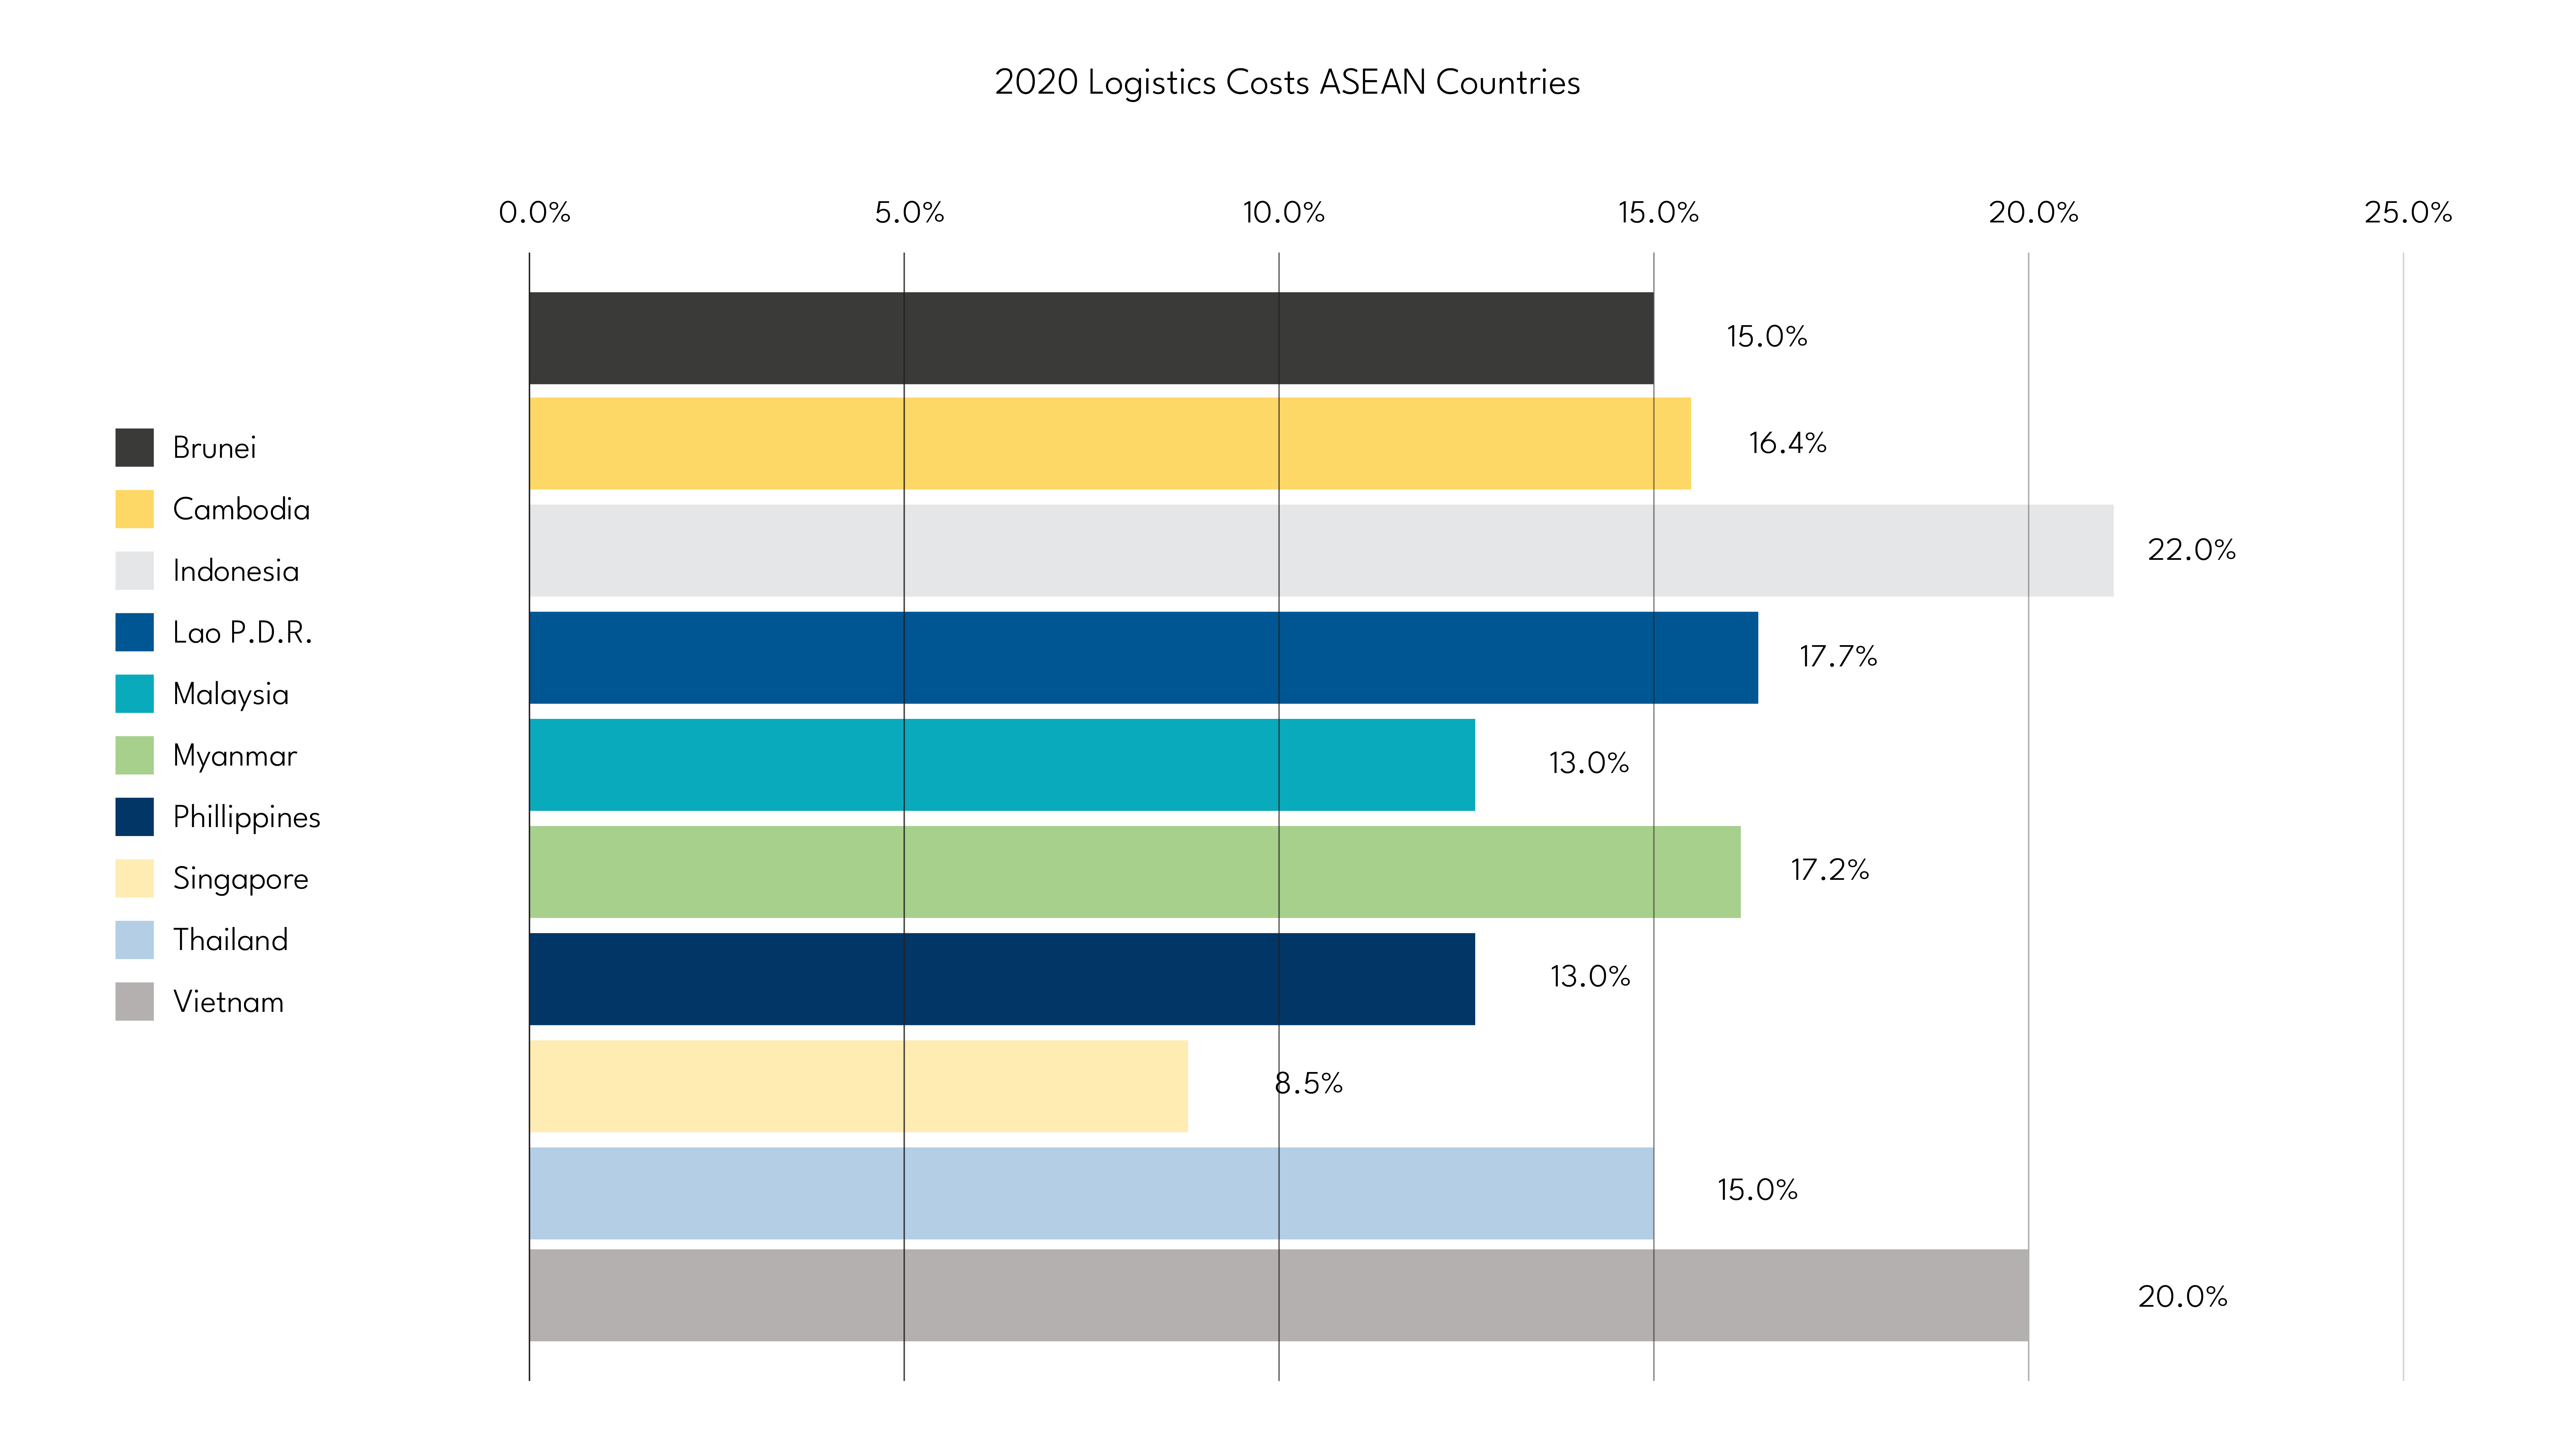
In terms of logistics costs, Indonesia still has the highest costs among the 10 ASEAN countries. Indonesia’s logistics costs in 2020 reached 22% of total GDP (Armstrong & Associates, Inc., 2020). In the National Logistics Discussion in August 2021, Arif Suhartono as President Director of PT Pelindo II explained that there are several causes of Indonesia’s high logistics costs, namely government regulations related to the logistics ecosystem that are not conducive, low land & maritime value chain efficiency, non-optimal port operations & infrastructure performance, and supply demand that is still Java-centric so that it is not balanced.
The Ministry of Transportation has undertaken several initiatives to reduce logistics costs and improve Indonesia’s logistics performance, including:
- Establishing the direction of marine transportation development policy for 2020-2024 to support national maritime connectivity.
- Implementing the hub and spoke concept at Indonesian ports as one of the efforts to support the Sea Toll program.
- Collaborating with Ministries/Institutions to form a National Logistic Ecosystem (NLE) to make the logistics process more efficient and integrated.
- Digitalization of port services, such as licensing, services, SIMLALA, SITOLAUT, Inaportnet in 54 ports.
In addition, on October 1, Pelindo I, III, and IV were merged into Pelindo II. This initiative aims to improve the effectiveness and efficiency of national ports. In addition, the merger of the four companies opens up opportunities to compete globally for Indonesia’s maritime logistics.
Source:
- Logistics Performance Index (LPI) 2007-2018 – World Bank (https://lpi.worldbank.org/international/global/2018)
- Global 3PL Market Size Estimates – Armstrong & Associates, Inc. (https://www.3plogistics.com/3pl-market-info-resources/3pl-market-information/global-3pl-market-size-estimates/)
- https://economy.okezone.com/read/2021/07/17/320/2442172/5-penyebab-biaya-logistik-di-ri-masih-tinggi?page=1
- https://hubla.dephub.go.id/home/post/read/10615/kemenhub-terus-berupaya-tekan-biaya-logistik-nasional
- https://jdih.bumn.go.id/berita/empat-bumn-pelabuhan-resmi-menjadi-satu-pelindo